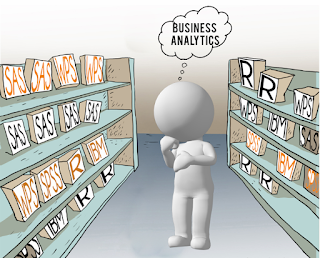
Business analytics is
a fast growing field and there are many tools available in the market to serve
the needs of organizations. The scope of analytical software goes from
relatively simple statistical tools in spreadsheets (e.g-MS Excel) to
statistical software packages (e.g-KXEN, Statistica) to practical business analytical tools (e.g-SAS, Oracle, SAP, IBM among the big players). Open source
tools such as R and Weka are also gaining popularity. Apart from these,
companies develop in-house tools designed for specific purposes.
Here is a list of 5
most popular analytic tools used in the business world.
SAS is the largest independent vendor in
the business analytics market. It is the most frequently used software in the
Indian analytics market despite its monopolistic cost. SAS software has
extensive ranging efficiencies from data management to advanced analytics.
STATISTICA
Statistica is a statistics and analytics
software package. It is developed by StatSoft. It provides data mining, data
management, data visualization and data analysis procedures. Statistica
supports an ample variety of analytic techniques and is capable of meeting most
needs of the business users. The GUI (Graphical User Interface) is not so much
user-friendly and it take more time to learn than some tools but it is a
competitively priced product that is value for money.
R is a
programming language and software environment for statistical computing and
graphics. The R Programming language is widely used in the midst of statisticians and data
miners for developing statistical software and data analysis. R and its
libraries implement a wide variety of statistical and graphical techniques,
including linear and nonlinear modeling, clustering, classical statistical
tests, classification, time-series analysis and many more.
MATLAB is a high-level language and
collective environment for numerical calculations, visualization, and
programming. It is developed by MathWorks in early 1980s. It allows plotting of
functions and data, implementation of algorithms, matrix manipulations,
interfacing with programs and creation of user interfaces. More than a million
scientists and engineers in industry and academics use MATLAB, which is the
language of technical computing.
Almost every business
user has access to MS Office suite and Excel. It is used for Statistical
analysis. While most people are aware of its excellent reporting and graphing
skills, excel can be a powerful analytic tool in the hands of an experienced
user. Current versions of Excel can handle tables up to 1 million rows making
it a powerful and versatile tool.


0 comments:
Post a Comment